ribs.visualize.aggregate_cdf
-
ribs.visualize.aggregate_cdf(archives: Collection[ArchiveBase], ax: Axes | None =
None, dfs: Collection[DataFrame] | Collection[ArchiveDataFrame] | None =None, cumulative: bool | Literal[-1] =True, bins: int | Sequence[float] | str | None =100, vmin: float | None =None, vmax: float | None =None, estimator: 'mean' | 'median' ='mean', errorbar: None | 'se' | 'sd' | 'iqr' ='sd', show_edges: bool =True) tuple[StepPatch, StepPatch][source]¶ Plots a CDF/CCDF aggregated over multiple archives.
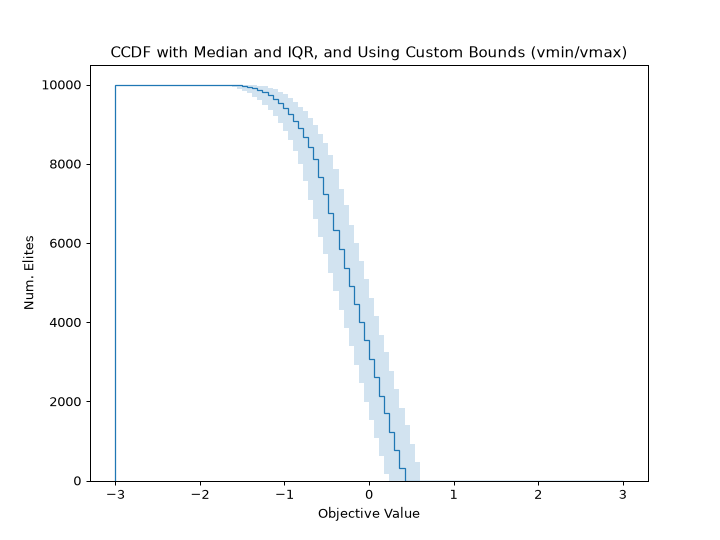
Generally, the CDF (cumulative distribution function) represents the number of observations that fall below each output value. In the case of archives, a CDF counts the number of elites that perform worse than or equal to each objective value. Conversely, a CCDF (complementary cumulative distribution function) counts the number of elites that perform better than or equal to each objective value.
This function approximates a CDF/CCDF over multiple archives by first computing a histogram over the objective values in each archive. Then, it performs a cumulative sum on the histograms to obtain a CDF/CCDF. Finally, it aggregates the CDFs/CCDFs by aggregating the number of values in each histogram’s bin. For example, if Archive 0’s CDF has 10 values in the bin [0, 0.1), and Archive 1’s CDF has 20 values in the bin [0, 0.1), and we aggregate values using the “mean” estimator, then the final histogram shows 15 values in the bin [0, 0.1).
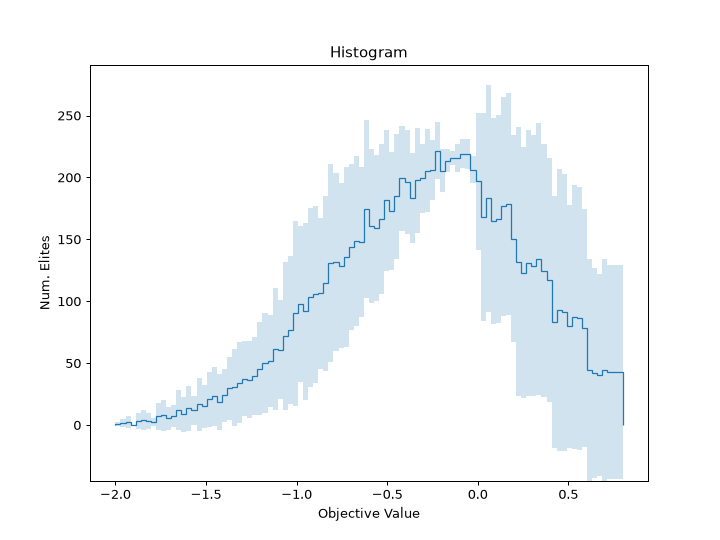
This function also supports plotting histograms by setting the cumulative parameter to False.
Info
The idea of using a CDF/CCDF to evaluate QD algorithms was introduced and formalized in Vassiliades 2018.
Examples
import numpy as np
import matplotlib.pyplot as plt
from ribs.archives import GridArchive
from ribs.visualize import aggregate_cdf

# Populate 5 archives with slightly offset versions of the negative sphere
# function.
archives = []
for i in range(5):
    archive = GridArchive(
        solution_dim=2, ranges=[(-1, 1), (-1, 1)], dims=[100, 100]
    )
    xxs, yys = np.meshgrid(np.linspace(-1, 1, 100), np.linspace(-1, 1, 100))
    xxs, yys = xxs.ravel(), yys.ravel()
    coords = np.stack((xxs, yys), axis=1)
    archive.add(
        solution=coords,
        objective=-(xxs**2 + yys**2) + 0.2 * i,  # Negative sphere, with offset.
        measures=coords,
    )
    archives.append(archive)

plt.figure(figsize=(8, 6))
line, _ = aggregate_cdf(archives, cumulative=True)
line.set_label("CDF using Mean and Std")
line, _ = aggregate_cdf(archives, cumulative=True, estimator="median", errorbar="iqr")
line.set_label("CDF using Median and IQR")
plt.title("CDF")
plt.xlabel("Objective Value")
plt.ylabel("Num. Elites")
plt.legend()

plt.figure(figsize=(8, 6))
aggregate_cdf(archives, cumulative=-1, estimator="median", errorbar="iqr", vmin=-3, vmax=3)
plt.title("CCDF with Median and IQR, and Using Custom Bounds (vmin/vmax)")
plt.xlabel("Objective Value")
plt.ylabel("Num. Elites")

plt.figure(figsize=(8, 6))
aggregate_cdf(archives, cumulative=False)
plt.title("Histogram")
plt.xlabel("Objective Value")
plt.ylabel("Num. Elites")

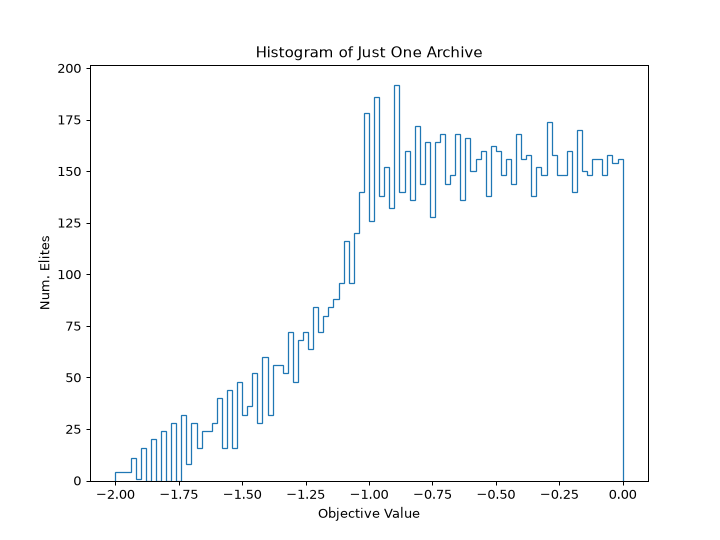
plt.figure(figsize=(8, 6))
aggregate_cdf(archives[:1], cumulative=False)
plt.title("Histogram of Just One Archive")
plt.xlabel("Objective Value")
plt.ylabel("Num. Elites")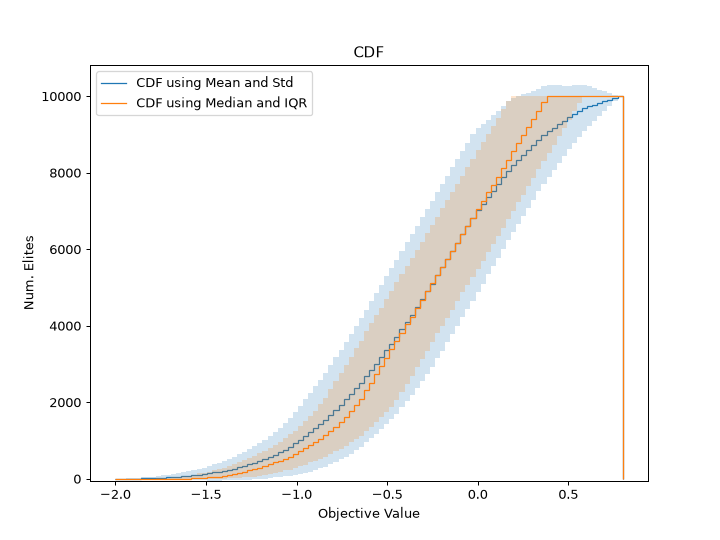
- Parameters:
- archives: Collection[ArchiveBase]
Archives to aggregate for the CDF/CCDF.
- ax: Axes | None =
None¶ Axes on which to plot the CDF/CCDF. If
None, the current axis will be used.- dfs: Collection[DataFrame] | Collection[ArchiveDataFrame] | None =
None¶ If provided, we will plot data from this sequence of dataframes instead of the data currently in the archives. This data can be obtained by, for instance, calling
ribs.archives.ArchiveBase.data()withreturn_type="pandas"and modifying the resultingArchiveDataFrame. Note that, at a minimum, each dataframe must contain a column for “objective”. The number of dataframes must be the same as the number of archives.- cumulative: bool | Literal[-1] =
True¶ Pass True to plot a CDF, -1 to plot a CCDF, and False to plot a histogram.
- bins: int | Sequence[float] | str | None =
100¶ Bins for the CDF/CCDF. The default of 100 indicates that there will be 100 equally-sized bins.
- vmin: float | None =
None¶ Minimum objective value to use in the plot. If
None, the minimum objective value across all the archives is used.- vmax: float | None =
None¶ Maximum objective value to use in the plot. If
None, the maximum objective value across all the archives is used.- estimator: 'mean' | 'median' =
'mean'¶ Method for aggregating the CDF/CCDF or histogram across the multiple archives. For example, if “mean” is passed, we count the number of entries in each histogram bin for each archive, and the final plot shows the mean number of entries in each bin.
- errorbar: None | 'se' | 'sd' | 'iqr' =
'sd'¶ Method for computing the errorbar for the CDF/CCDF or histogram. For example, if “sd” is passed, we display an errorbar showing the standard deviation of the number of entries in each histogram bin. Options are “sd” (standard deviation), “se” (standard error of the mean), “iqr” (interquartile range, i.e., the interval from the 25th to 75th percentile), and None (no error bar).
- show_edges: bool =
True¶ Whether to show the left and right edges of the CDF/CCDF or histogram (these show up as vertical lines).
- Returns:
Tuple of two Matplotlib patches. The first patch is for the line, while the second is for the errorbar.
- Raises:
AttributeError – The data() method is not implemented on one of the archives.
ValueError – Number of dfs passed in is not the same as the number of archives.