ribs.visualize.archive_ecdf
-
ribs.visualize.archive_ecdf(archive: ArchiveBase, df: DataFrame | ArchiveDataFrame | None =
None, **kwargs) Axes[source]¶ Plots an ECDF or ECCDF of the objective values in an archive.
Generally, the ECDF (empirical cumulative distribution function) counts the number of observations that fall below each output value. In the case of archives, an ECDF counts the number of elites that perform worse than or equal to each objective value. Conversely, an ECCDF (empirical complementary cumulative distribution function) counts the number of elites that perform better than or equal to each objective value.
This function is a thin wrapper around Seaborn’s
ecdfplot()that extracts the objective values from the archive and then passes them as data. All kwargs are also passed directly toecdfplot. Similar to other pyribs visualization functions, one can also pass in the archive and adfpreviously extracted from the archive’sdata()method.Examples
ECDF of a GridArchive
import numpy as np
import matplotlib.pyplot as plt
from ribs.archives import GridArchive
from ribs.visualize import archive_ecdf

# Populate the archive with the negative sphere function.
archive = GridArchive(solution_dim=2,
                      dims=[10, 10],
                      ranges=[(-1, 1), (-1, 1)])
x = np.random.uniform(-1, 1, 10000)
y = np.random.uniform(-1, 1, 10000)
archive.add(solution=np.stack((x, y), axis=1),
            objective=-(x**2 + y**2),
            measures=np.stack((x, y), axis=1))

# Plot ECDF of the archive.
plt.figure(figsize=(8, 6))
archive_ecdf(archive, stat="count")
plt.xlabel("Objective")
plt.ylabel("Num. Elites")
plt.show()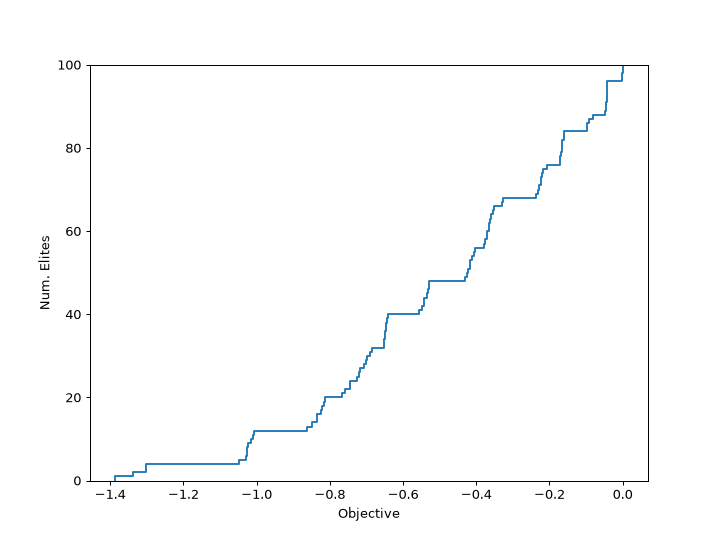
ECCDF of a GridArchive
import numpy as np
import matplotlib.pyplot as plt
from ribs.archives import GridArchive
from ribs.visualize import archive_ecdf

# Populate the archive with the negative sphere function.
archive = GridArchive(solution_dim=2,
                      dims=[10, 10],
                      ranges=[(-1, 1), (-1, 1)])
x = np.random.uniform(-1, 1, 10000)
y = np.random.uniform(-1, 1, 10000)
archive.add(solution=np.stack((x, y), axis=1),
            objective=-(x**2 + y**2),
            measures=np.stack((x, y), axis=1))

# Plot ECCDF of the archive. Note the use of `complementary`.
plt.figure(figsize=(8, 6))
archive_ecdf(archive, complementary=True, stat="count")
plt.xlabel("Objective")
plt.ylabel("Num. Elites")
plt.show()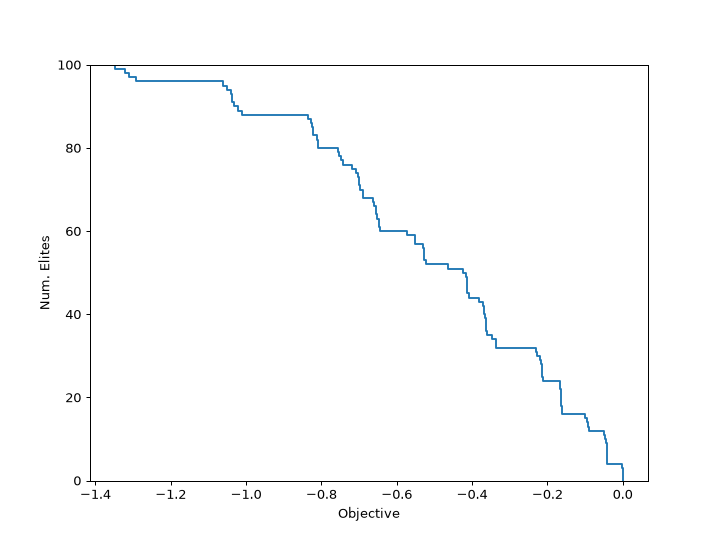
- Parameters:
- archive: ArchiveBase
An archive that can provide its objective values via the
data()method.- df: DataFrame | ArchiveDataFrame | None =
None¶ If provided, we will plot data from this argument instead of the data currently in the archive. This data can be obtained by, for instance, calling
ribs.archives.ArchiveBase.data()withreturn_type="pandas"and modifying the resultingArchiveDataFrame. Note that, at a minimum, the data must contain a column for “objective”.- **kwargs
Kwargs for
ecdfplot().
- Returns:
The Matplotlib axes containing the plot.
- Raises:
AttributeError – The data() method is not implemented on the given archive, which prevents retrieving its objective values.